How to Build a Fintech Cashflow Screen in Flutter (Full Code + Preview)
Most cashflow charts in Flutter start with a charting package, a controller, and a build-size bump — all to draw twelve rectangles. This tutorial builds a Revolut-style cashflow screen with none of that: a paired money-in vs money-out bar chart made from `Expanded`, `FractionallySizedBox`, and rounded `Container`s, a 'Net this month' summary card with a positive pill, and a monthly breakdown list that computes each month's net on the fly. You end up with one self-contained, dark-themed Dart file you can drop straight into any finance app.
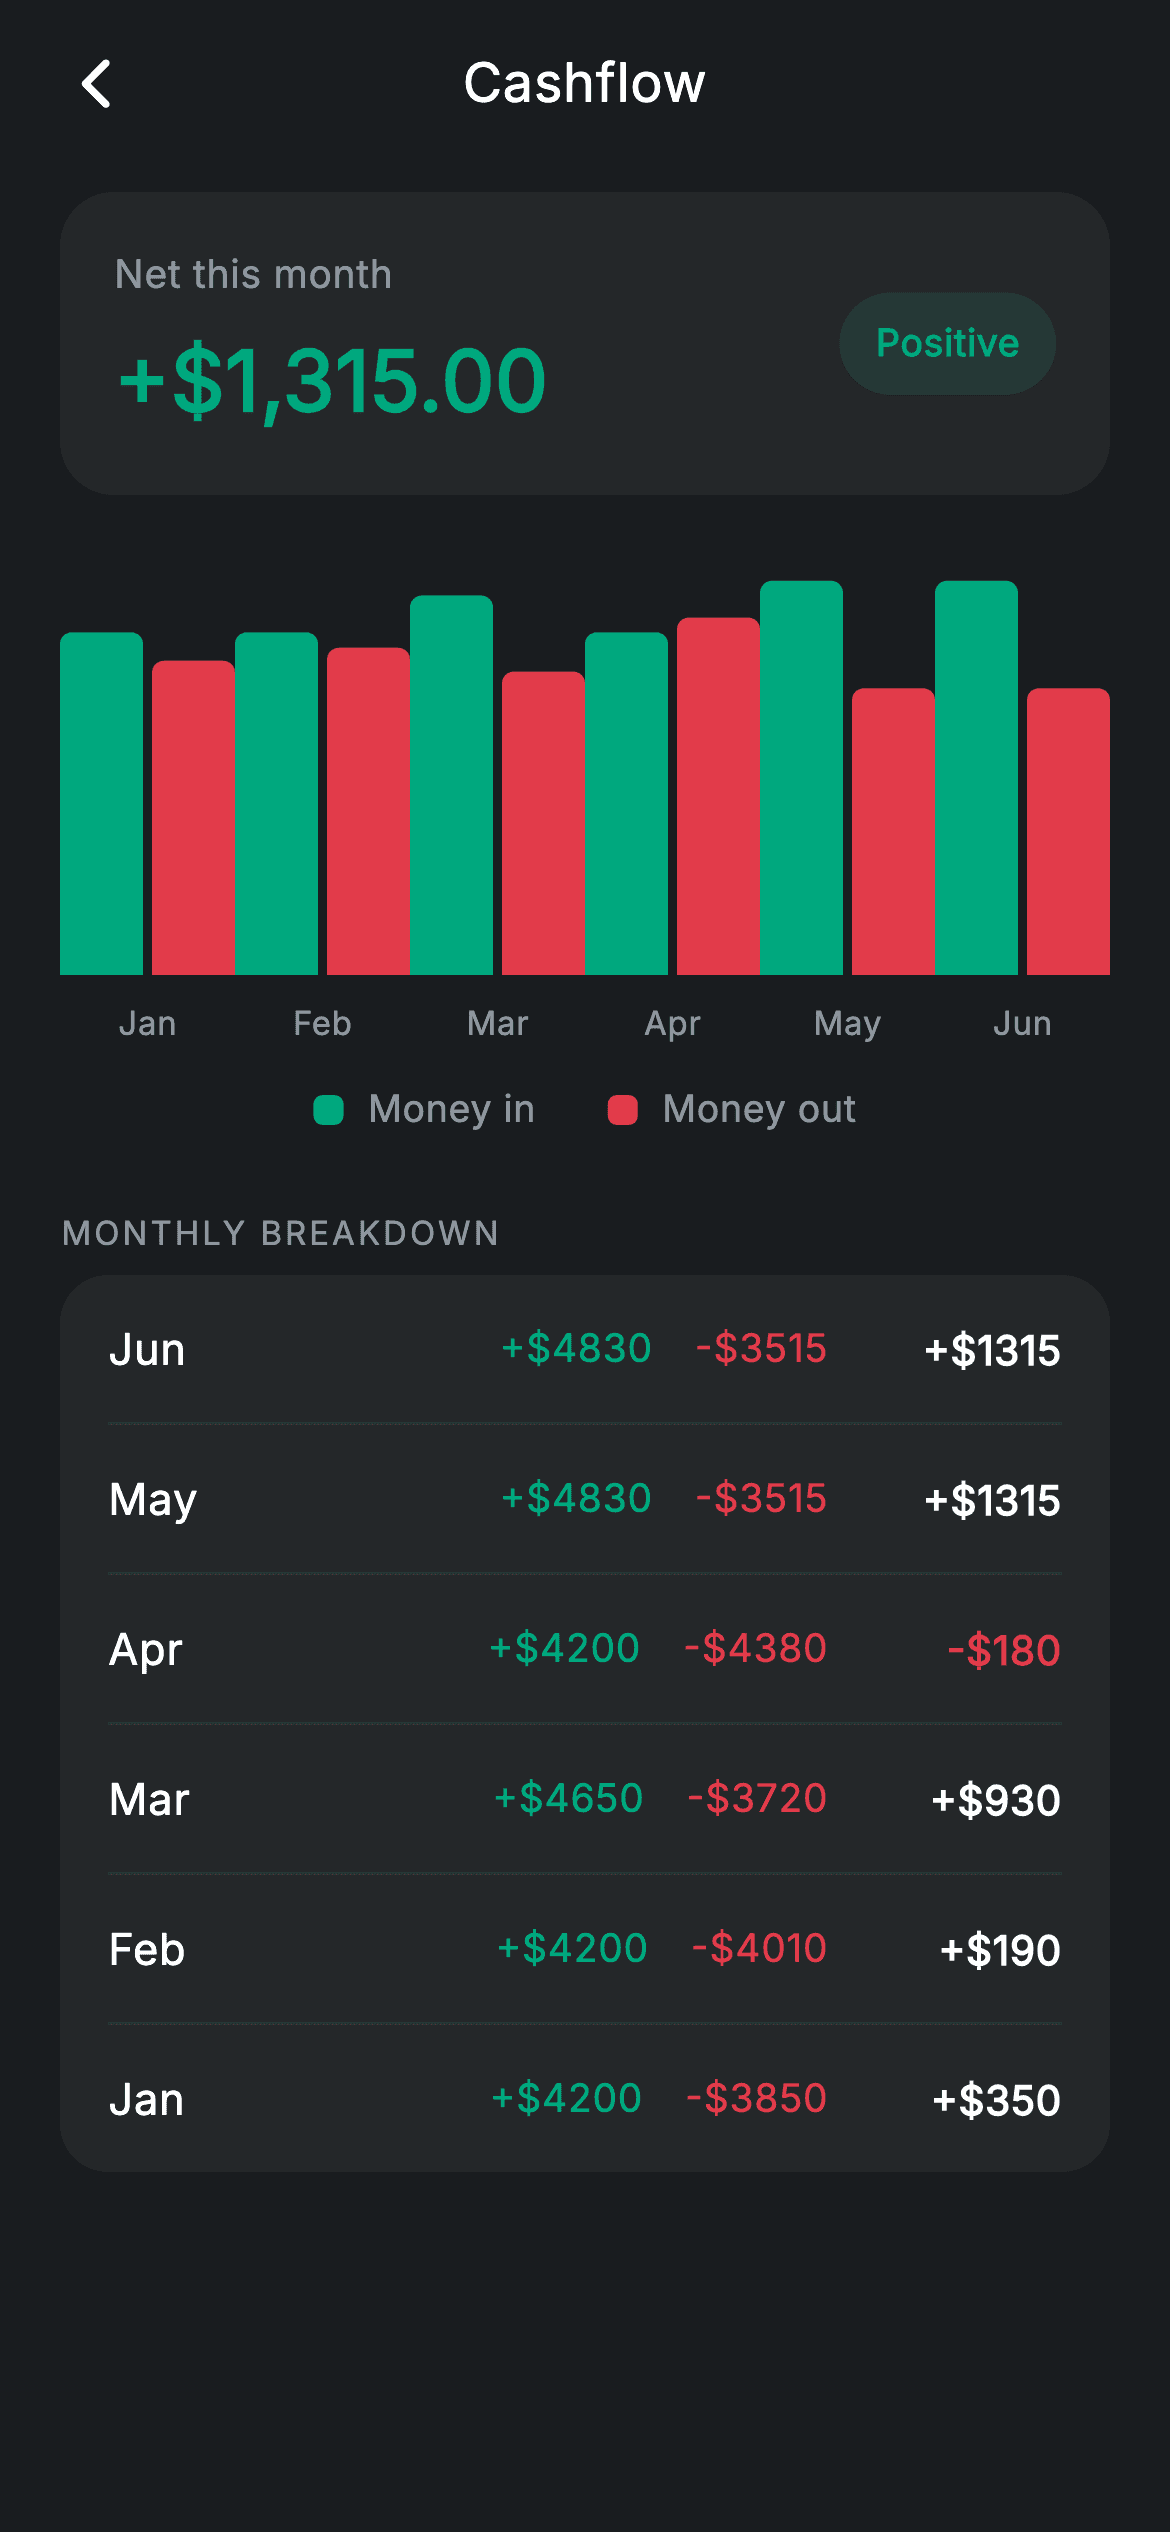
What you'll build
- ✓A paired bar chart comparing income and spend across six months, built from plain widgets with zero chart dependencies
- ✓A 'Net this month' summary card showing +$1,315.00 in teal beside a tinted 'Positive' status pill
- ✓A monthly breakdown card that lists months newest-first and derives each net from income minus outgoing at build time
- ✓A reusable `_bar` helper that scales any value against a $5,000 ceiling with `FractionallySizedBox`
- ✓A forced dark theme with a six-colour Revolut-inspired palette and the bundled Inter font
Step-by-step build
Create the file
Add a new file at lib/fintech_cashflow/fintech_cashflow_screen.dart in your Flutter project.
Register the bundled fonts
No external packages — this is pure Flutter. It does bundle its design font (Inter), so drop the font file into fonts/ and declare it in pubspec.yaml:
flutter:
  fonts:
    - family: Inter
      fonts:
- asset: fonts/Inter-Regular.ttfBuild it, piece by piece
Here's how the screen goes together. Each block below is a real slice of the code with a plain-English explanation — paste them in order, or grab the whole file from the next section.
One list of month records drives the whole screen
import 'package:flutter/material.dart';

/// Cashflow — money in vs out over time (Revolut-inspired design system).
///
/// Self-contained per CONVENTIONS.md: pure Flutter only, the exact design font
/// (Inter) is bundled under `fonts/`, the paired bar chart is built from plain
/// widgets (no charting package, no network), and the screen forces its own
/// dark theme. A net summary and per-month breakdown complete the picture.
class FintechCashflowScreen extends StatelessWidget {
  const FintechCashflowScreen({super.key, this.onBack});

  final VoidCallback? onBack;

  static const String _font = 'Inter';
  static const Color _bg = Color(0xFF191C1F);
  static const Color _surface = Color(0xFF242729);
  static const Color _teal = Color(0xFF00A87E);
  static const Color _red = Color(0xFFE23B4A);
  static const Color _muted = Color(0xFF8D969E);
  static const Color _hairline = Color(0xFF2E3235);

  static const List<_Month> _months = <_Month>[
    _Month('Jan', 4200, 3850),
    _Month('Feb', 4200, 4010),
    _Month('Mar', 4650, 3720),
    _Month('Apr', 4200, 4380),
    _Month('May', 4830, 3515),
    _Month('Jun', 4830, 3515),
  ];

  static const double _maxVal = 5000;
`FintechCashflowScreen` is a `StatelessWidget` with a single `onBack` callback — nothing on this screen mutates, so there is no state class to maintain. The palette is six `static const Color`s: a near-black `_bg` (0xFF191C1F), a lighter `_surface` for cards, `_teal` for money in, `_red` for money out, plus `_muted` and `_hairline` for secondary text and dividers. The interesting decision is `_months`: six `_Month(label, income, outgoing)` records are the only data on the screen — the chart, the legend maths, and the breakdown list are all projections of this one list. `_maxVal = 5000` is the shared chart ceiling every bar is scaled against, so bar heights stay comparable across months.
Forcing dark mode and laying out the scroll
  @override
  Widget build(BuildContext context) {
    return Theme(
      data: ThemeData.dark(useMaterial3: true),
      child: Scaffold(
        backgroundColor: _bg,
        body: SafeArea(
          child: Column(
            children: <Widget>[
              _buildAppBar(),
              Expanded(
                child: ListView(
                  physics: const BouncingScrollPhysics(),
                  padding: const EdgeInsets.fromLTRB(20, 8, 20, 24),
                  children: <Widget>[
                    _buildNet(),
                    const SizedBox(height: 24),
                    _buildChart(),
                    const SizedBox(height: 12),
                    _buildLegend(),
                    const SizedBox(height: 24),
                    _sectionLabel('Monthly breakdown'),
                    const SizedBox(height: 6),
                    Container(
                      padding: const EdgeInsets.symmetric(horizontal: 16),
                      decoration: BoxDecoration(
                        color: _surface,
                        borderRadius: BorderRadius.circular(16),
                      ),
                      child: Column(
                        children: <Widget>[
                          for (int i = _months.length - 1; i >= 0; i--) ...<Widget>[
                            if (i != _months.length - 1)
                              const Divider(height: 1, color: _hairline),
                            _MonthRow(month: _months[i]),
                          ],
                        ],
                      ),
                    ),
                  ],
                ),
              ),
            ],
          ),
        ),
      ),
    );
  }
The build wraps everything in `Theme(data: ThemeData.dark(useMaterial3: true))`, so the screen renders dark even inside a light-themed host app — it carries its own theme rather than inheriting one. Inside a `SafeArea`, the app bar stays fixed while an `Expanded` `ListView` with `BouncingScrollPhysics` scrolls the net card, chart, legend, and breakdown. The breakdown card uses a reversed collection-for — `for (int i = _months.length - 1; i >= 0; i--)` — so June appears first, matching how people read a finance history (most recent month on top), and the `if (i != _months.length - 1)` guard inserts a 1px `_hairline` `Divider` between rows but never above the first one.
A hand-balanced app bar
  Widget _buildAppBar() {
    return Padding(
      padding: const EdgeInsets.fromLTRB(8, 4, 8, 4),
      child: Row(
        children: <Widget>[
          IconButton(
            onPressed: onBack,
            icon: const Icon(Icons.arrow_back_ios_new_rounded,
                size: 20, color: Colors.white),
          ),
          const Expanded(
            child: Text(
              'Cashflow',
              textAlign: TextAlign.center,
              style: TextStyle(
                fontFamily: _font,
                fontSize: 18,
                fontWeight: FontWeight.w500,
                letterSpacing: 0.24,
                color: Colors.white,
              ),
            ),
          ),
          const SizedBox(width: 48),
        ],
      ),
    );
  }
Rather than a Material `AppBar`, the header is a plain `Row`: an `IconButton` firing `onBack`, an `Expanded` centred 'Cashflow' title, and a trailing `SizedBox(width: 48)`. That 48px box is the whole trick — it mirrors the standard `IconButton` footprint on the left, so `textAlign: TextAlign.center` lands the title on the true horizontal centre of the screen instead of drifting right. The title is 18px `w500` Inter with a subtle 0.24 letter-spacing that every text style on this screen repeats.
The net summary card and its status pill
  Widget _buildNet() {
    return Container(
      padding: const EdgeInsets.all(18),
      decoration: BoxDecoration(
        color: _surface,
        borderRadius: BorderRadius.circular(18),
      ),
      child: Row(
        children: <Widget>[
          Column(
            crossAxisAlignment: CrossAxisAlignment.start,
            children: const <Widget>[
              Text(
                'Net this month',
                style: TextStyle(
                  fontFamily: _font,
                  fontSize: 13,
                  letterSpacing: 0.24,
                  color: _muted,
                ),
              ),
              SizedBox(height: 6),
              Text(
                r'+$1,315.00',
                style: TextStyle(
                  fontFamily: _font,
                  fontSize: 28,
                  fontWeight: FontWeight.w600,
                  letterSpacing: 0.24,
                  color: _teal,
                ),
              ),
            ],
          ),
          const Spacer(),
          Container(
            padding: const EdgeInsets.symmetric(horizontal: 12, vertical: 8),
            decoration: BoxDecoration(
              color: _teal.withValues(alpha: 0.16),
              borderRadius: BorderRadius.circular(9999),
            ),
            child: const Text(
              'Positive',
              style: TextStyle(
                fontFamily: _font,
                fontSize: 12.5,
                fontWeight: FontWeight.w600,
                letterSpacing: 0.24,
                color: _teal,
              ),
            ),
          ),
        ],
      ),
    );
  }
`_buildNet` is a `_surface` container with 18px padding and an 18px corner radius holding a two-line column — a 13px `_muted` 'Net this month' label over the 28px `w600` figure — pushed apart from a status pill by a `Spacer`. The amount string is a raw literal (`r'+$1,315.00'`) so the dollar sign is not read as Dart interpolation, and it renders in `_teal` because the month is positive. The pill's background is `_teal.withValues(alpha: 0.16)` with a `borderRadius` of 9999 — a tint of the same hue as its 'Positive' text, so the badge reads as a state of the number rather than a separate element.
A paired bar chart with no charting package
  Widget _buildChart() {
    return SizedBox(
      height: 160,
      child: Row(
        crossAxisAlignment: CrossAxisAlignment.end,
        children: <Widget>[
          for (final _Month m in _months)
            Expanded(
              child: Column(
                children: <Widget>[
                  Expanded(
                    child: Row(
                      crossAxisAlignment: CrossAxisAlignment.end,
                      mainAxisAlignment: MainAxisAlignment.center,
                      children: <Widget>[
                        _bar(m.income / _maxVal, _teal),
                        const SizedBox(width: 3),
                        _bar(m.outgoing / _maxVal, _red),
                      ],
                    ),
                  ),
                  const SizedBox(height: 8),
                  Text(
                    m.label,
                    style: const TextStyle(
                      fontFamily: _font,
                      fontSize: 11,
                      letterSpacing: 0.24,
                      color: _muted,
                    ),
                  ),
                ],
              ),
            ),
        ],
      ),
    );
  }

  Widget _bar(double frac, Color color) {
    return Expanded(
      child: Align(
        alignment: Alignment.bottomCenter,
        child: FractionallySizedBox(
          heightFactor: frac.clamp(0.02, 1),
          child: Container(
            decoration: BoxDecoration(
              color: color,
              borderRadius: const BorderRadius.vertical(top: Radius.circular(4)),
            ),
          ),
        ),
      ),
    );
  }
The chart is a 160px-tall `Row` with `crossAxisAlignment: CrossAxisAlignment.end`, one `Expanded` column per month so six months always share the width evenly. Each column stacks a bottom-aligned pair of bars — `_bar(m.income / _maxVal, _teal)` and `_bar(m.outgoing / _maxVal, _red)` separated by a 3px gap — above the 11px month label. `_bar` does the actual scaling: an `Align(alignment: Alignment.bottomCenter)` holding a `FractionallySizedBox` whose `heightFactor` is `frac.clamp(0.02, 1)`, so bars grow up from the baseline and a zero-value month still shows a 2% sliver instead of vanishing. Only the top corners get a 4px radius, keeping the baseline flat.
Legend dots and a spaced-caps section label
  Widget _buildLegend() {
    return Row(
      mainAxisAlignment: MainAxisAlignment.center,
      children: <Widget>[
        _legendDot(_teal, 'Money in'),
        const SizedBox(width: 24),
        _legendDot(_red, 'Money out'),
      ],
    );
  }

  Widget _legendDot(Color color, String label) {
    return Row(
      mainAxisSize: MainAxisSize.min,
      children: <Widget>[
        Container(
          width: 10,
          height: 10,
          decoration: BoxDecoration(
            color: color,
            borderRadius: BorderRadius.circular(3),
          ),
        ),
        const SizedBox(width: 8),
        Text(
          label,
          style: const TextStyle(
            fontFamily: _font,
            fontSize: 12.5,
            letterSpacing: 0.24,
            color: _muted,
          ),
        ),
      ],
    );
  }

  Widget _sectionLabel(String text) {
    return Text(
      text.toUpperCase(),
      style: const TextStyle(
        fontFamily: _font,
        fontSize: 11,
        fontWeight: FontWeight.w500,
        letterSpacing: 1.0,
        color: _muted,
      ),
    );
  }
`_buildLegend` centres two `_legendDot` rows 24px apart, each a 10px square with a 3px corner radius beside 12.5px `_muted` text — 'Money in' in `_teal`, 'Money out' in `_red`, the same hues the bars use, so the mapping needs no explanation. `mainAxisSize: MainAxisSize.min` keeps each dot-label pair hugging its content so the outer `mainAxisAlignment: MainAxisAlignment.center` can do the positioning. `_sectionLabel` upper-cases its text at 11px with `letterSpacing: 1.0`, the classic spaced-caps treatment that separates 'MONTHLY BREAKDOWN' from the data below without stealing visual weight.
The month model and a net computed at build time
class _Month {
  const _Month(this.label, this.income, this.outgoing);
  final String label;
  final double income;
  final double outgoing;
}

class _MonthRow extends StatelessWidget {
  const _MonthRow({required this.month});

  final _Month month;

  @override
  Widget build(BuildContext context) {
    final double net = month.income - month.outgoing;
    final bool positive = net >= 0;
    return Padding(
      padding: const EdgeInsets.symmetric(vertical: 14),
      child: Row(
        children: <Widget>[
          SizedBox(
            width: 44,
            child: Text(
              month.label,
              style: const TextStyle(
                fontFamily: FintechCashflowScreen._font,
                fontSize: 14.5,
                fontWeight: FontWeight.w500,
                letterSpacing: 0.24,
                color: Colors.white,
              ),
            ),
          ),
          const Spacer(),
          Text(
            '+\$${month.income.toStringAsFixed(0)}',
            style: const TextStyle(
              fontFamily: FintechCashflowScreen._font,
              fontSize: 13,
              letterSpacing: 0.24,
              color: FintechCashflowScreen._teal,
            ),
          ),
          const SizedBox(width: 14),
          Text(
            '-\$${month.outgoing.toStringAsFixed(0)}',
            style: const TextStyle(
              fontFamily: FintechCashflowScreen._font,
              fontSize: 13,
              letterSpacing: 0.24,
              color: FintechCashflowScreen._red,
            ),
          ),
          const SizedBox(width: 14),
          SizedBox(
            width: 64,
            child: Text(
              '${positive ? '+' : '-'}\$${net.abs().toStringAsFixed(0)}',
              textAlign: TextAlign.right,
              style: TextStyle(
                fontFamily: FintechCashflowScreen._font,
                fontSize: 13.5,
                fontWeight: FontWeight.w600,
                letterSpacing: 0.24,
                color: positive ? Colors.white : FintechCashflowScreen._red,
              ),
            ),
          ),
        ],
      ),
    );
  }
}
`_Month` is a three-field const value class — `label`, `income`, `outgoing` — deliberately storing no net, because `_MonthRow` derives it in build: `final double net = month.income - month.outgoing;` and `final bool positive = net >= 0;`. That keeps the data honest (a stored net could drift out of sync with its parts). The row lays out a fixed 44px month label, a `Spacer`, then income in `_teal` with a `+` prefix, outgoing in `_red` with a `-`, and the net right-aligned in a fixed 64px `SizedBox` so amounts line up down the column. The sign logic is `'${positive ? '+' : '-'}\$${net.abs().toStringAsFixed(0)}'` — the value is shown as an absolute with an explicit sign, and only a negative net turns the text `_red`; a positive net stays white so the column doesn't shout.
Full code
The complete, ready-to-paste source. Free to use in your projects — one click copies it all.
import 'package:flutter/material.dart';

/// Cashflow — money in vs out over time (Revolut-inspired design system).
///
/// Self-contained per CONVENTIONS.md: pure Flutter only, the exact design font
/// (Inter) is bundled under `fonts/`, the paired bar chart is built from plain
/// widgets (no charting package, no network), and the screen forces its own
/// dark theme. A net summary and per-month breakdown complete the picture.
class FintechCashflowScreen extends StatelessWidget {
  const FintechCashflowScreen({super.key, this.onBack});

  final VoidCallback? onBack;

  static const String _font = 'Inter';
  static const Color _bg = Color(0xFF191C1F);
  static const Color _surface = Color(0xFF242729);
  static const Color _teal = Color(0xFF00A87E);
  static const Color _red = Color(0xFFE23B4A);
  static const Color _muted = Color(0xFF8D969E);
  static const Color _hairline = Color(0xFF2E3235);

  static const List<_Month> _months = <_Month>[
    _Month('Jan', 4200, 3850),
    _Month('Feb', 4200, 4010),
    _Month('Mar', 4650, 3720),
    _Month('Apr', 4200, 4380),
    _Month('May', 4830, 3515),
    _Month('Jun', 4830, 3515),
  ];

  static const double _maxVal = 5000;

  @override
  Widget build(BuildContext context) {
    return Theme(
      data: ThemeData.dark(useMaterial3: true),
      child: Scaffold(
        backgroundColor: _bg,
        body: SafeArea(
          child: Column(
            children: <Widget>[
              _buildAppBar(),
              Expanded(
                child: ListView(
                  physics: const BouncingScrollPhysics(),
                  padding: const EdgeInsets.fromLTRB(20, 8, 20, 24),
                  children: <Widget>[
                    _buildNet(),
                    const SizedBox(height: 24),
                    _buildChart(),
                    const SizedBox(height: 12),
                    _buildLegend(),
                    const SizedBox(height: 24),
                    _sectionLabel('Monthly breakdown'),
                    const SizedBox(height: 6),
                    Container(
                      padding: const EdgeInsets.symmetric(horizontal: 16),
                      decoration: BoxDecoration(
                        color: _surface,
                        borderRadius: BorderRadius.circular(16),
                      ),
                      child: Column(
                        children: <Widget>[
                          for (int i = _months.length - 1; i >= 0; i--) ...<Widget>[
                            if (i != _months.length - 1)
                              const Divider(height: 1, color: _hairline),
                            _MonthRow(month: _months[i]),
                          ],
                        ],
                      ),
                    ),
                  ],
                ),
              ),
            ],
          ),
        ),
      ),
    );
  }

  Widget _buildAppBar() {
    return Padding(
      padding: const EdgeInsets.fromLTRB(8, 4, 8, 4),
      child: Row(
        children: <Widget>[
          IconButton(
            onPressed: onBack,
            icon: const Icon(Icons.arrow_back_ios_new_rounded,
                size: 20, color: Colors.white),
          ),
          const Expanded(
            child: Text(
              'Cashflow',
              textAlign: TextAlign.center,
              style: TextStyle(
                fontFamily: _font,
                fontSize: 18,
                fontWeight: FontWeight.w500,
                letterSpacing: 0.24,
                color: Colors.white,
              ),
            ),
          ),
          const SizedBox(width: 48),
        ],
      ),
    );
  }

  Widget _buildNet() {
    return Container(
      padding: const EdgeInsets.all(18),
      decoration: BoxDecoration(
        color: _surface,
        borderRadius: BorderRadius.circular(18),
      ),
      child: Row(
        children: <Widget>[
          Column(
            crossAxisAlignment: CrossAxisAlignment.start,
            children: const <Widget>[
              Text(
                'Net this month',
                style: TextStyle(
                  fontFamily: _font,
                  fontSize: 13,
                  letterSpacing: 0.24,
                  color: _muted,
                ),
              ),
              SizedBox(height: 6),
              Text(
                r'+$1,315.00',
                style: TextStyle(
                  fontFamily: _font,
                  fontSize: 28,
                  fontWeight: FontWeight.w600,
                  letterSpacing: 0.24,
                  color: _teal,
                ),
              ),
            ],
          ),
          const Spacer(),
          Container(
            padding: const EdgeInsets.symmetric(horizontal: 12, vertical: 8),
            decoration: BoxDecoration(
              color: _teal.withValues(alpha: 0.16),
              borderRadius: BorderRadius.circular(9999),
            ),
            child: const Text(
              'Positive',
              style: TextStyle(
                fontFamily: _font,
                fontSize: 12.5,
                fontWeight: FontWeight.w600,
                letterSpacing: 0.24,
                color: _teal,
              ),
            ),
          ),
        ],
      ),
    );
  }

  Widget _buildChart() {
    return SizedBox(
      height: 160,
      child: Row(
        crossAxisAlignment: CrossAxisAlignment.end,
        children: <Widget>[
          for (final _Month m in _months)
            Expanded(
              child: Column(
                children: <Widget>[
                  Expanded(
                    child: Row(
                      crossAxisAlignment: CrossAxisAlignment.end,
                      mainAxisAlignment: MainAxisAlignment.center,
                      children: <Widget>[
                        _bar(m.income / _maxVal, _teal),
                        const SizedBox(width: 3),
                        _bar(m.outgoing / _maxVal, _red),
                      ],
                    ),
                  ),
                  const SizedBox(height: 8),
                  Text(
                    m.label,
                    style: const TextStyle(
                      fontFamily: _font,
                      fontSize: 11,
                      letterSpacing: 0.24,
                      color: _muted,
                    ),
                  ),
                ],
              ),
            ),
        ],
      ),
    );
  }

  Widget _bar(double frac, Color color) {
    return Expanded(
      child: Align(
        alignment: Alignment.bottomCenter,
        child: FractionallySizedBox(
          heightFactor: frac.clamp(0.02, 1),
          child: Container(
            decoration: BoxDecoration(
              color: color,
              borderRadius: const BorderRadius.vertical(top: Radius.circular(4)),
            ),
          ),
        ),
      ),
    );
  }

  Widget _buildLegend() {
    return Row(
      mainAxisAlignment: MainAxisAlignment.center,
      children: <Widget>[
        _legendDot(_teal, 'Money in'),
        const SizedBox(width: 24),
        _legendDot(_red, 'Money out'),
      ],
    );
  }

  Widget _legendDot(Color color, String label) {
    return Row(
      mainAxisSize: MainAxisSize.min,
      children: <Widget>[
        Container(
          width: 10,
          height: 10,
          decoration: BoxDecoration(
            color: color,
            borderRadius: BorderRadius.circular(3),
          ),
        ),
        const SizedBox(width: 8),
        Text(
          label,
          style: const TextStyle(
            fontFamily: _font,
            fontSize: 12.5,
            letterSpacing: 0.24,
            color: _muted,
          ),
        ),
      ],
    );
  }

  Widget _sectionLabel(String text) {
    return Text(
      text.toUpperCase(),
      style: const TextStyle(
        fontFamily: _font,
        fontSize: 11,
        fontWeight: FontWeight.w500,
        letterSpacing: 1.0,
        color: _muted,
      ),
    );
  }
}

class _Month {
  const _Month(this.label, this.income, this.outgoing);
  final String label;
  final double income;
  final double outgoing;
}

class _MonthRow extends StatelessWidget {
  const _MonthRow({required this.month});

  final _Month month;

  @override
  Widget build(BuildContext context) {
    final double net = month.income - month.outgoing;
    final bool positive = net >= 0;
    return Padding(
      padding: const EdgeInsets.symmetric(vertical: 14),
      child: Row(
        children: <Widget>[
          SizedBox(
            width: 44,
            child: Text(
              month.label,
              style: const TextStyle(
                fontFamily: FintechCashflowScreen._font,
                fontSize: 14.5,
                fontWeight: FontWeight.w500,
                letterSpacing: 0.24,
                color: Colors.white,
              ),
            ),
          ),
          const Spacer(),
          Text(
            '+\$${month.income.toStringAsFixed(0)}',
            style: const TextStyle(
              fontFamily: FintechCashflowScreen._font,
              fontSize: 13,
              letterSpacing: 0.24,
              color: FintechCashflowScreen._teal,
            ),
          ),
          const SizedBox(width: 14),
          Text(
            '-\$${month.outgoing.toStringAsFixed(0)}',
            style: const TextStyle(
              fontFamily: FintechCashflowScreen._font,
              fontSize: 13,
              letterSpacing: 0.24,
              color: FintechCashflowScreen._red,
            ),
          ),
          const SizedBox(width: 14),
          SizedBox(
            width: 64,
            child: Text(
              '${positive ? '+' : '-'}\$${net.abs().toStringAsFixed(0)}',
              textAlign: TextAlign.right,
              style: TextStyle(
                fontFamily: FintechCashflowScreen._font,
                fontSize: 13.5,
                fontWeight: FontWeight.w600,
                letterSpacing: 0.24,
                color: positive ? Colors.white : FintechCashflowScreen._red,
              ),
            ),
          ),
        ],
      ),
    );
  }
}
Plus bundled 1 binary asset (fonts/images). The CLI and MCP install those for you automatically.
Two faster ways to add it
Copy-paste works, but you can skip it entirely.
1. FlutterKit CLI
One command drops this screen — and its fonts — straight into your project.
$ flutterkit add fintech-cashflow2. AI agent (MCP)
Connect FlutterKit's MCP server in Claude or Cursor and just ask your agent to install fintech-cashflow — it fetches and writes the files for you.
FAQ
Can I use this cashflow screen in a commercial Flutter app?
Yes. FlutterKit screens are free to use, including commercially. You can ship this cashflow screen in a client project, a paid fintech app, or an internal tool without attribution.
Which packages does this screen need?
None. The paired bar chart is built entirely from `Row`, `Expanded`, `Align`, and `FractionallySizedBox` — no fl_chart or other charting dependency, and no network calls. The only asset is the Inter font, which ships bundled with the screen under `fonts/` and is referenced by the `_font` constant.
What Flutter version does this code require?
Flutter 3.27 or newer, because the status pill uses `Color.withValues(alpha: 0.16)`, which replaced the deprecated `withOpacity`. On an older SDK, swap that one call to `_teal.withOpacity(0.16)`. The `super.key` constructor parameter also assumes Dart 2.17+, which any recent Flutter includes.
How do I feed the chart real transaction data?
Replace the `static const _months` list with a list you build from your backend — one `_Month(label, income, outgoing)` per period — and pass it into the widget as a constructor parameter instead of a static. Also compute `_maxVal` from the data (for example `months.map((m) => max(m.income, m.outgoing)).reduce(max)`) so the tallest bar always reaches full height; with the hard-coded 5000 ceiling, a big month would clamp and a quiet year would look flat.
Why does the monthly breakdown list run newest-first while the chart runs oldest-first?
They serve different reading modes. The chart's `for (final _Month m in _months)` keeps chronological order because a trend only makes sense left-to-right in time. The breakdown card iterates backwards (`for (int i = _months.length - 1; i >= 0; i--)`) so June sits at the top — when you scan a list of months you want the most recent one without scrolling, the same convention banking apps use for statements.


