How to Build a Fintech Spending Analytics Screen in Flutter (Full Code + Preview)
Spending analytics is the screen that makes a fintech app feel intelligent, and the usual shortcut — pulling in a charting package — costs you control over every pixel. This tutorial builds Revolut-style analytics in pure Flutter: a donut chart painted with rounded, gapped arcs by a compact CustomPainter, a total computed from the slice data rather than hard-coded, a weekly bar trend built from nothing but FractionallySizedBox, month filter pills, three quick-link tiles, and the shared five-tab bottom bar, all on a forced dark theme.
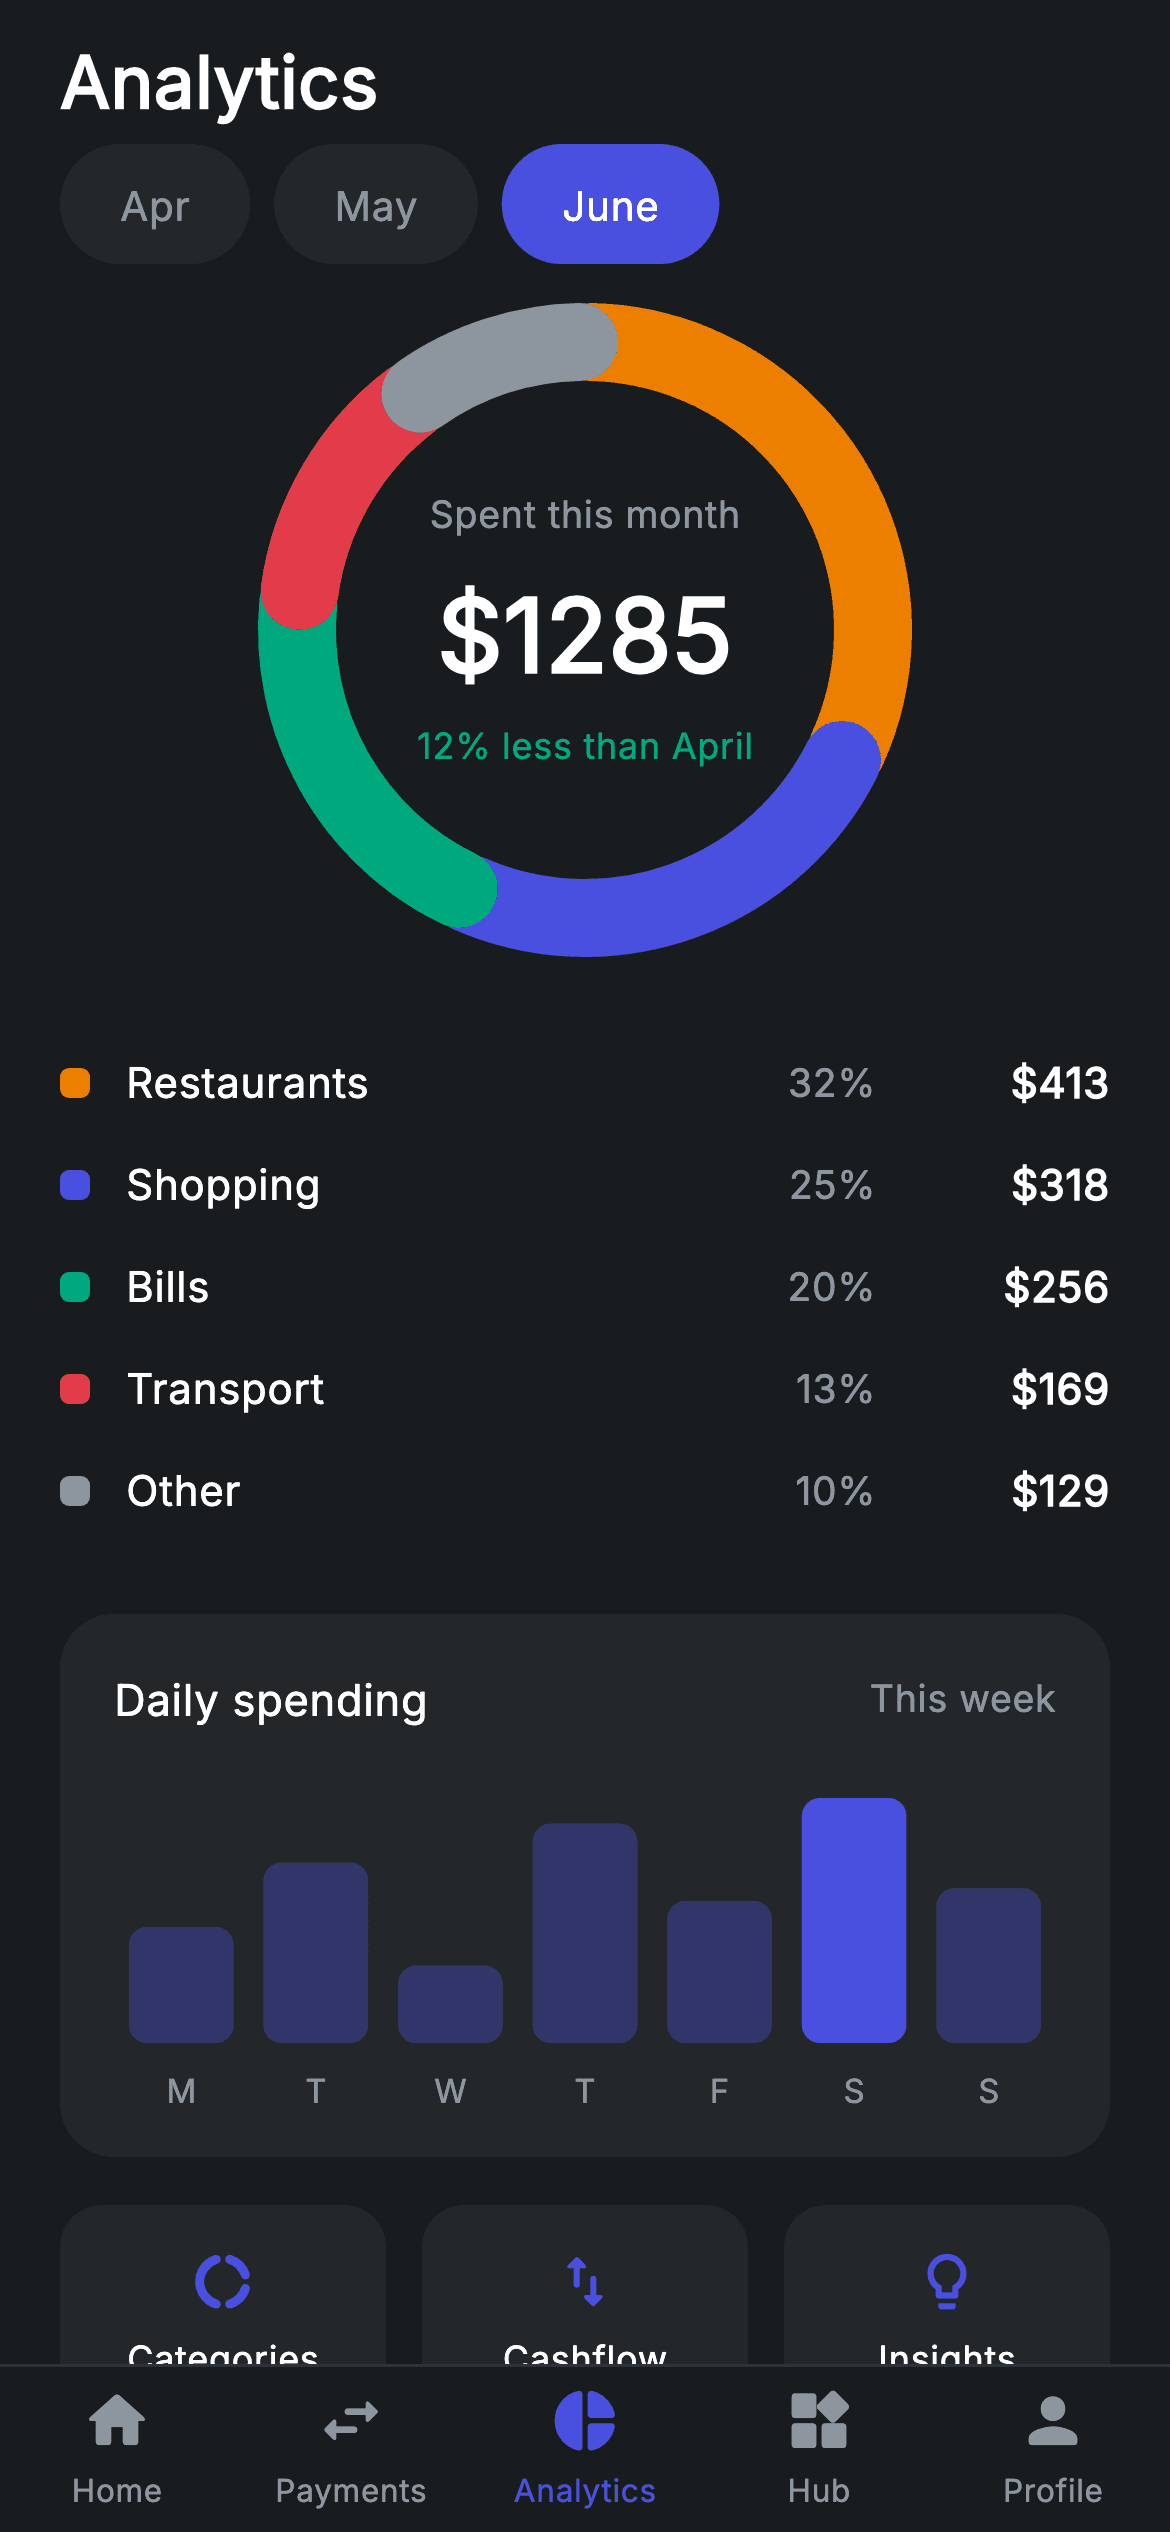
What you'll build
- ✓A donut chart with rounded, gapped arcs drawn by a CustomPainter — no charting package
- ✓A 'Spent this month' centre readout whose $1,285 total is folded from the slice list at runtime
- ✓A seven-day bar trend where FractionallySizedBox turns 0–1 values into bar heights and Saturday gets the solid brand colour
- ✓Category legend rows with computed percentages and a fixed-width, right-aligned amount column
- ✓Month filter pills, three quick-link tiles, and a five-tab bottom bar wired through callbacks
Step-by-step build
Create the file
Add a new file at lib/fintech_analytics/fintech_analytics_screen.dart in your Flutter project.
Register the bundled fonts
No external packages — this is pure Flutter. It does bundle its design font (Inter), so drop the font file into fonts/ and declare it in pubspec.yaml:
flutter:
  fonts:
    - family: Inter
      fonts:
- asset: fonts/Inter-Regular.ttfBuild it, piece by piece
Here's how the screen goes together. Each block below is a real slice of the code with a plain-English explanation — paste them in order, or grab the whole file from the next section.
A tab screen that talks through callbacks
import 'package:flutter/material.dart';

/// Analytics — spending overview with donut + weekly trend (Revolut-inspired).
///
/// Self-contained per CONVENTIONS.md: pure Flutter only, the exact design font
/// (Inter) is bundled under `fonts/`, every chart is custom-painted (no charting
/// package, no network), and the screen forces its own dark theme. This is the
/// Analytics bottom-nav tab, so it carries the shared 5-tab bar via callback.
class FintechAnalyticsScreen extends StatefulWidget {
  const FintechAnalyticsScreen({
    super.key,
    this.onTabSelected,
    this.onCategories,
    this.onCashflow,
    this.onInsights,
  });

  final ValueChanged<int>? onTabSelected;
  final VoidCallback? onCategories;
  final VoidCallback? onCashflow;
  final VoidCallback? onInsights;

  @override
  State<FintechAnalyticsScreen> createState() => _FintechAnalyticsScreenState();
}
The doc comment pins the constraints: pure Flutter, bundled Inter, every chart custom-painted, dark theme forced from inside. Because this is the Analytics tab of a five-tab app, the widget takes `onTabSelected` as a `ValueChanged<int>` so the host decides what tapping 'Home' or 'Profile' does, plus three optional `VoidCallback`s — `onCategories`, `onCashflow`, `onInsights` — for the quick-link tiles at the bottom. It is a `StatefulWidget` for exactly one reason, which shows up next: the selected month pill.
Palette, slices, and a total that computes itself
class _FintechAnalyticsScreenState extends State<FintechAnalyticsScreen> {
  static const String _font = 'Inter';
  static const Color _bg = Color(0xFF191C1F);
  static const Color _surface = Color(0xFF242729);
  static const Color _brand = Color(0xFF494FDF);
  static const Color _teal = Color(0xFF00A87E);
  static const Color _amber = Color(0xFFEC7E00);
  static const Color _red = Color(0xFFE23B4A);
  static const Color _muted = Color(0xFF8D969E);

  static const List<String> _months = <String>['Apr', 'May', 'June'];
  int _month = 2;

  static const List<_Slice> _slices = <_Slice>[
    _Slice('Restaurants', 412.80, _amber),
    _Slice('Shopping', 318.40, _brand),
    _Slice('Bills', 256.20, _teal),
    _Slice('Transport', 168.90, _red),
    _Slice('Other', 128.50, _muted),
  ];

  static const List<double> _trend = <double>[
    0.45, 0.7, 0.3, 0.85, 0.55, 0.95, 0.6
  ];
  static const List<String> _days = <String>['M', 'T', 'W', 'T', 'F', 'S', 'S'];

  double get _total =>
      _slices.fold<double>(0, (double s, _Slice e) => s + e.amount);
The palette is seven `static const` colours: `_bg` (0xFF191C1F) and `_surface` (0xFF242729) for the dark ground, indigo `_brand` (0xFF494FDF) as the app accent, and `_teal`/`_amber`/`_red`/`_muted` doubling as category colours. `_slices` holds five `_Slice(label, amount, color)` records — Restaurants at 412.80 down to Other at 128.50 — and `_trend` is seven pre-normalised 0–1 doubles for the weekly bars. The key move is the `_total` getter: a `fold` over `_slices`, so the centre figure, every legend percentage, and the donut sweeps all derive from the same list. Edit one amount and the whole screen re-agrees. `_month = 2` (June) is the only mutable state.
Scaffold layout, title, and month pills
  @override
  Widget build(BuildContext context) {
    return Theme(
      data: ThemeData.dark(useMaterial3: true),
      child: Scaffold(
        backgroundColor: _bg,
        body: SafeArea(
          bottom: false,
          child: Column(
            children: <Widget>[
              _buildAppBar(),
              _buildMonthTabs(),
              Expanded(
                child: ListView(
                  physics: const BouncingScrollPhysics(),
                  padding: const EdgeInsets.fromLTRB(20, 12, 20, 24),
                  children: <Widget>[
                    _buildDonut(),
                    const SizedBox(height: 24),
                    _buildLegend(),
                    const SizedBox(height: 24),
                    _buildTrendCard(),
                    const SizedBox(height: 16),
                    _buildQuickLinks(),
                  ],
                ),
              ),
              _buildNavBar(),
            ],
          ),
        ),
      ),
    );
  }

  Widget _buildAppBar() {
    return const Padding(
      padding: EdgeInsets.fromLTRB(20, 10, 20, 4),
      child: Row(
        children: <Widget>[
          Text(
            'Analytics',
            style: TextStyle(
              fontFamily: _font,
              fontSize: 24,
              fontWeight: FontWeight.w600,
              letterSpacing: 0.24,
              color: Colors.white,
            ),
          ),
        ],
      ),
    );
  }

  Widget _buildMonthTabs() {
    return SizedBox(
      height: 40,
      child: ListView.separated(
        scrollDirection: Axis.horizontal,
        padding: const EdgeInsets.symmetric(horizontal: 20),
        physics: const BouncingScrollPhysics(),
        itemCount: _months.length,
        separatorBuilder: (BuildContext context, int i) =>
            const SizedBox(width: 8),
        itemBuilder: (BuildContext context, int i) {
          final bool active = _month == i;
          return GestureDetector(
            onTap: () => setState(() => _month = i),
            child: Container(
              alignment: Alignment.center,
              padding: const EdgeInsets.symmetric(horizontal: 20),
              decoration: BoxDecoration(
                color: active ? _brand : _surface,
                borderRadius: BorderRadius.circular(9999),
              ),
              child: Text(
                _months[i],
                style: TextStyle(
                  fontFamily: _font,
                  fontSize: 13.5,
                  fontWeight: FontWeight.w500,
                  letterSpacing: 0.24,
                  color: active ? Colors.white : _muted,
                ),
              ),
            ),
          );
        },
      ),
    );
  }
`build` wraps everything in `Theme(data: ThemeData.dark(useMaterial3: true))` so the screen stays dark regardless of the host app's theme, and `SafeArea(bottom: false)` leaves the bottom inset for the nav bar to handle itself. The structure is a Column: title, month tabs, then an `Expanded` `ListView` with `BouncingScrollPhysics` holding donut, legend, trend card and quick links — the nav bar sits outside the scroll so it never moves. The month picker is a 40px-tall horizontal `ListView.separated` of pills rounded with `BorderRadius.circular(9999)`; the active pill fills with `_brand` and white text while inactive ones sit on `_surface` in `_muted`, and tapping just runs `setState(() => _month = i)`.
The donut and its centre readout
  Widget _buildDonut() {
    return SizedBox(
      height: 220,
      child: Stack(
        alignment: Alignment.center,
        children: <Widget>[
          SizedBox(
            width: 220,
            height: 220,
            child: CustomPaint(
              painter: _DonutPainter(
                slices: _slices,
                total: _total,
              ),
            ),
          ),
          Column(
            mainAxisSize: MainAxisSize.min,
            children: <Widget>[
              const Text(
                'Spent this month',
                style: TextStyle(
                  fontFamily: _font,
                  fontSize: 12.5,
                  letterSpacing: 0.24,
                  color: _muted,
                ),
              ),
              const SizedBox(height: 6),
              Text(
                '\$${_total.toStringAsFixed(0)}',
                style: const TextStyle(
                  fontFamily: _font,
                  fontSize: 34,
                  fontWeight: FontWeight.w600,
                  letterSpacing: 0.24,
                  color: Colors.white,
                ),
              ),
              const SizedBox(height: 4),
              const Text(
                '12% less than April',
                style: TextStyle(
                  fontFamily: _font,
                  fontSize: 12,
                  fontWeight: FontWeight.w500,
                  letterSpacing: 0.24,
                  color: _teal,
                ),
              ),
            ],
          ),
        ],
      ),
    );
  }
The chart is a 220px `Stack` with `alignment: Alignment.center`: a `CustomPaint` running `_DonutPainter` behind, and a `Column` floating in the donut's hole. That column is the screen's headline — a muted 12.5px 'Spent this month' label, the total rendered as `'\$${_total.toStringAsFixed(0)}'` at 34px w600, and a `_teal` '12% less than April' delta line. Painting the ring and composing the text as ordinary widgets, instead of drawing text on the canvas, keeps the numbers selectable for layout tweaks and lets the total stay live against `_slices`.
Legend rows with computed percentages
  Widget _buildLegend() {
    return Column(
      children: <Widget>[
        for (final _Slice s in _slices)
          Padding(
            padding: const EdgeInsets.symmetric(vertical: 7),
            child: Row(
              children: <Widget>[
                Container(
                  width: 10,
                  height: 10,
                  decoration: BoxDecoration(
                    color: s.color,
                    borderRadius: BorderRadius.circular(3),
                  ),
                ),
                const SizedBox(width: 12),
                Expanded(
                  child: Text(
                    s.label,
                    style: const TextStyle(
                      fontFamily: _font,
                      fontSize: 14,
                      fontWeight: FontWeight.w500,
                      letterSpacing: 0.24,
                      color: Colors.white,
                    ),
                  ),
                ),
                Text(
                  '${(s.amount / _total * 100).round()}%',
                  style: const TextStyle(
                    fontFamily: _font,
                    fontSize: 13,
                    letterSpacing: 0.24,
                    color: _muted,
                  ),
                ),
                const SizedBox(width: 14),
                SizedBox(
                  width: 64,
                  child: Text(
                    '\$${s.amount.toStringAsFixed(0)}',
                    textAlign: TextAlign.right,
                    style: const TextStyle(
                      fontFamily: _font,
                      fontSize: 14,
                      fontWeight: FontWeight.w600,
                      letterSpacing: 0.24,
                      color: Colors.white,
                    ),
                  ),
                ),
              ],
            ),
          ),
      ],
    );
  }
The legend is a collection-`for` over `_slices`, one Row per category. Each row leads with a 10px rounded-square swatch (`BorderRadius.circular(3)`) in the slice's colour — matching the donut arc it labels — then the category name in an `Expanded` so it absorbs leftover width. The percentage is computed on the spot, `(s.amount / _total * 100).round()`, never stored, so it can't drift from the amounts. The dollar figure sits in a `SizedBox(width: 64)` with `textAlign: TextAlign.right`, which lines all five amounts up like a table column instead of letting them ragged-edge against varying percentage widths.
A bar chart made of FractionallySizedBox
  Widget _buildTrendCard() {
    return Container(
      padding: const EdgeInsets.fromLTRB(18, 18, 18, 14),
      decoration: BoxDecoration(
        color: _surface,
        borderRadius: BorderRadius.circular(18),
      ),
      child: Column(
        crossAxisAlignment: CrossAxisAlignment.start,
        children: <Widget>[
          Row(
            mainAxisAlignment: MainAxisAlignment.spaceBetween,
            children: const <Widget>[
              Text(
                'Daily spending',
                style: TextStyle(
                  fontFamily: _font,
                  fontSize: 14.5,
                  fontWeight: FontWeight.w500,
                  letterSpacing: 0.24,
                  color: Colors.white,
                ),
              ),
              Text(
                'This week',
                style: TextStyle(
                  fontFamily: _font,
                  fontSize: 12.5,
                  letterSpacing: 0.24,
                  color: _muted,
                ),
              ),
            ],
          ),
          const SizedBox(height: 18),
          SizedBox(
            height: 110,
            child: Row(
              crossAxisAlignment: CrossAxisAlignment.end,
              children: <Widget>[
                for (int i = 0; i < _trend.length; i++)
                  Expanded(
                    child: Column(
                      children: <Widget>[
                        Expanded(
                          child: Align(
                            alignment: Alignment.bottomCenter,
                            child: FractionallySizedBox(
                              heightFactor: _trend[i],
                              child: Container(
                                margin:
                                    const EdgeInsets.symmetric(horizontal: 5),
                                decoration: BoxDecoration(
                                  color: i == 5 ? _brand : _brand.withValues(alpha: 0.35),
                                  borderRadius: BorderRadius.circular(6),
                                ),
                              ),
                            ),
                          ),
                        ),
                        const SizedBox(height: 8),
                        Text(
                          _days[i],
                          style: const TextStyle(
                            fontFamily: _font,
                            fontSize: 11,
                            letterSpacing: 0.24,
                            color: _muted,
                          ),
                        ),
                      ],
                    ),
                  ),
              ],
            ),
          ),
        ],
      ),
    );
  }
The 'Daily spending' card proves you don't need a painter for bars. Inside a 110px Row with `crossAxisAlignment: CrossAxisAlignment.end`, each day is an `Expanded` column: a bottom-aligned `FractionallySizedBox(heightFactor: _trend[i])` whose child Container is the bar, then the day letter beneath. The 0–1 values in `_trend` become heights for free — no pixel maths. The highlight rule is a single ternary: `i == 5 ? _brand : _brand.withValues(alpha: 0.35)`, so Saturday's 0.95 peak reads solid indigo while the other six days fade to 35% of the same hue, keeping the chart monochrome rather than rainbow. The 5px horizontal margins are what create the gutters between Expanded slots.
Quick links and the shared five-tab bar
  Widget _buildQuickLinks() {
    return Row(
      children: <Widget>[
        _link(Icons.donut_large_rounded, 'Categories', widget.onCategories),
        const SizedBox(width: 12),
        _link(Icons.swap_vert_rounded, 'Cashflow', widget.onCashflow),
        const SizedBox(width: 12),
        _link(Icons.lightbulb_outline_rounded, 'Insights', widget.onInsights),
      ],
    );
  }

  Widget _link(IconData icon, String label, VoidCallback? onTap) {
    return Expanded(
      child: InkWell(
        borderRadius: BorderRadius.circular(14),
        onTap: onTap,
        child: Container(
          height: 74,
          decoration: BoxDecoration(
            color: _surface,
            borderRadius: BorderRadius.circular(14),
          ),
          child: Column(
            mainAxisAlignment: MainAxisAlignment.center,
            children: <Widget>[
              Icon(icon, size: 22, color: _brand),
              const SizedBox(height: 6),
              Text(
                label,
                style: const TextStyle(
                  fontFamily: _font,
                  fontSize: 12,
                  fontWeight: FontWeight.w500,
                  letterSpacing: 0.24,
                  color: Colors.white,
                ),
              ),
            ],
          ),
        ),
      ),
    );
  }

  Widget _buildNavBar() {
    const List<IconData> icons = <IconData>[
      Icons.home_rounded,
      Icons.swap_horiz_rounded,
      Icons.pie_chart_rounded,
      Icons.widgets_rounded,
      Icons.person_rounded,
    ];
    const List<String> labels = <String>[
      'Home',
      'Payments',
      'Analytics',
      'Hub',
      'Profile'
    ];
    return Container(
      decoration: const BoxDecoration(
        color: _bg,
        border: Border(top: BorderSide(color: Color(0xFF2E3235))),
      ),
      child: SafeArea(
        top: false,
        child: Padding(
          padding: const EdgeInsets.symmetric(vertical: 6),
          child: Row(
            children: <Widget>[
              for (int i = 0; i < icons.length; i++)
                Expanded(
                  child: GestureDetector(
                    onTap: () => widget.onTabSelected?.call(i),
                    behavior: HitTestBehavior.opaque,
                    child: Column(
                      mainAxisSize: MainAxisSize.min,
                      children: <Widget>[
                        Icon(
                          icons[i],
                          size: 24,
                          color: i == 2 ? _brand : _muted,
                        ),
                        const SizedBox(height: 4),
                        Text(
                          labels[i],
                          style: TextStyle(
                            fontFamily: _font,
                            fontSize: 10.5,
                            fontWeight: FontWeight.w500,
                            letterSpacing: 0.24,
                            color: i == 2 ? _brand : _muted,
                          ),
                        ),
                      ],
                    ),
                  ),
                ),
            ],
          ),
        ),
      ),
    );
  }
`_buildQuickLinks` is three equal-width `_link` tiles — Categories, Cashflow, Insights — each an `Expanded` `InkWell` over a 74px `_surface` container with a 22px `_brand` icon, wired straight to the widget's optional callbacks so the tiles are inert until the host provides navigation. The nav bar draws its own top hairline with `Border(top: BorderSide(color: Color(0xFF2E3235)))` and wraps its Row in `SafeArea(top: false)`, which is why the outer scaffold skipped the bottom inset. Each tab is a `GestureDetector` with `HitTestBehavior.opaque` so the whole slot is tappable, and index 2 (this screen) tints icon and 10.5px label `_brand` while the rest stay `_muted`.
The donut painter: gaps, round caps, and -90°
class _Slice {
  const _Slice(this.label, this.amount, this.color);
  final String label;
  final double amount;
  final Color color;
}

/// Paints a rounded donut chart from the slices, with small gaps between arcs.
class _DonutPainter extends CustomPainter {
  _DonutPainter({required this.slices, required this.total});

  final List<_Slice> slices;
  final double total;

  @override
  void paint(Canvas canvas, Size size) {
    final Offset center = size.center(Offset.zero);
    final double radius = size.width / 2 - 14;
    const double stroke = 26;
    final Rect rect = Rect.fromCircle(center: center, radius: radius);

    const double gap = 0.04;
    double start = -1.5708; // -90°
    for (final _Slice s in slices) {
      final double sweep = (s.amount / total) * 6.2832 - gap;
      final Paint paint = Paint()
        ..color = s.color
        ..style = PaintingStyle.stroke
        ..strokeWidth = stroke
        ..strokeCap = StrokeCap.round;
      canvas.drawArc(rect, start + gap / 2, sweep, false, paint);
      start += (s.amount / total) * 6.2832;
    }
  }

  @override
  bool shouldRepaint(covariant _DonutPainter oldDelegate) =>
      oldDelegate.total != total || oldDelegate.slices != slices;
}
`_Slice` is a three-field const value class, and `_DonutPainter` turns it into arcs in one loop. The geometry: `radius = size.width / 2 - 14` pulls the arc centreline inward so the 26px `stroke` (13px each side, plus a little for the round caps) never clips the 220px box. `start` begins at `-1.5708` — minus 90°, i.e. 12 o'clock — and each slice's sweep is its fraction of `6.2832` (2π) minus a `gap` of 0.04 radians; drawing from `start + gap / 2` splits that gap evenly across each boundary. Crucially, `start` still advances by the full un-gapped fraction, so the gaps stay uniform instead of accumulating. `StrokeCap.round` gives every arc soft ends, and `shouldRepaint` compares `total` and `slices` so the ring only redraws when the data actually changes.
Full code
The complete, ready-to-paste source. Free to use in your projects — one click copies it all.
import 'package:flutter/material.dart';
/// Analytics — spending overview with donut + weekly trend (Revolut-inspired).
///
/// Self-contained per CONVENTIONS.md: pure Flutter only, the exact design font
/// (Inter) is bundled under `fonts/`, every chart is custom-painted (no charting
/// package, no network), and the screen forces its own dark theme. This is the
/// Analytics bottom-nav tab, so it carries the shared 5-tab bar via callback.
class FintechAnalyticsScreen extends StatefulWidget {
const FintechAnalyticsScreen({
super.key,
this.onTabSelected,
this.onCategories,
this.onCashflow,
this.onInsights,
});
final ValueChanged<int>? onTabSelected;
final VoidCallback? onCategories;
final VoidCallback? onCashflow;
final VoidCallback? onInsights;
@override
State<FintechAnalyticsScreen> createState() => _FintechAnalyticsScreenState();
}
class _FintechAnalyticsScreenState extends State<FintechAnalyticsScreen> {
static const String _font = 'Inter';
static const Color _bg = Color(0xFF191C1F);
static const Color _surface = Color(0xFF242729);
static const Color _brand = Color(0xFF494FDF);
static const Color _teal = Color(0xFF00A87E);
static const Color _amber = Color(0xFFEC7E00);
static const Color _red = Color(0xFFE23B4A);
static const Color _muted = Color(0xFF8D969E);
static const List<String> _months = <String>['Apr', 'May', 'June'];
int _month = 2;
static const List<_Slice> _slices = <_Slice>[
_Slice('Restaurants', 412.80, _amber),
_Slice('Shopping', 318.40, _brand),
_Slice('Bills', 256.20, _teal),
_Slice('Transport', 168.90, _red),
_Slice('Other', 128.50, _muted),
];
static const List<double> _trend = <double>[
0.45, 0.7, 0.3, 0.85, 0.55, 0.95, 0.6
];
static const List<String> _days = <String>['M', 'T', 'W', 'T', 'F', 'S', 'S'];
double get _total =>
_slices.fold<double>(0, (double s, _Slice e) => s + e.amount);
@override
Widget build(BuildContext context) {
return Theme(
data: ThemeData.dark(useMaterial3: true),
child: Scaffold(
backgroundColor: _bg,
body: SafeArea(
bottom: false,
child: Column(
children: <Widget>[
_buildAppBar(),
_buildMonthTabs(),
Expanded(
child: ListView(
physics: const BouncingScrollPhysics(),
padding: const EdgeInsets.fromLTRB(20, 12, 20, 24),
children: <Widget>[
_buildDonut(),
const SizedBox(height: 24),
_buildLegend(),
const SizedBox(height: 24),
_buildTrendCard(),
const SizedBox(height: 16),
_buildQuickLinks(),
],
),
),
_buildNavBar(),
],
),
),
),
);
}
Widget _buildAppBar() {
return const Padding(
padding: EdgeInsets.fromLTRB(20, 10, 20, 4),
child: Row(
children: <Widget>[
Text(
'Analytics',
style: TextStyle(
fontFamily: _font,
fontSize: 24,
fontWeight: FontWeight.w600,
letterSpacing: 0.24,
color: Colors.white,
),
),
],
),
);
}
Widget _buildMonthTabs() {
return SizedBox(
height: 40,
child: ListView.separated(
scrollDirection: Axis.horizontal,
padding: const EdgeInsets.symmetric(horizontal: 20),
physics: const BouncingScrollPhysics(),
itemCount: _months.length,
separatorBuilder: (BuildContext context, int i) =>
const SizedBox(width: 8),
itemBuilder: (BuildContext context, int i) {
final bool active = _month == i;
return GestureDetector(
onTap: () => setState(() => _month = i),
child: Container(
alignment: Alignment.center,
padding: const EdgeInsets.symmetric(horizontal: 20),
decoration: BoxDecoration(
color: active ? _brand : _surface,
borderRadius: BorderRadius.circular(9999),
),
child: Text(
_months[i],
style: TextStyle(
fontFamily: _font,
fontSize: 13.5,
fontWeight: FontWeight.w500,
letterSpacing: 0.24,
color: active ? Colors.white : _muted,
),
),
),
);
},
),
);
}
Widget _buildDonut() {
return SizedBox(
height: 220,
child: Stack(
alignment: Alignment.center,
children: <Widget>[
SizedBox(
width: 220,
height: 220,
child: CustomPaint(
painter: _DonutPainter(
slices: _slices,
total: _total,
),
),
),
Column(
mainAxisSize: MainAxisSize.min,
children: <Widget>[
const Text(
'Spent this month',
style: TextStyle(
fontFamily: _font,
fontSize: 12.5,
letterSpacing: 0.24,
color: _muted,
),
),
const SizedBox(height: 6),
Text(
'\$${_total.toStringAsFixed(0)}',
style: const TextStyle(
fontFamily: _font,
fontSize: 34,
fontWeight: FontWeight.w600,
letterSpacing: 0.24,
color: Colors.white,
),
),
const SizedBox(height: 4),
const Text(
'12% less than April',
style: TextStyle(
fontFamily: _font,
fontSize: 12,
fontWeight: FontWeight.w500,
letterSpacing: 0.24,
color: _teal,
),
),
],
),
],
),
);
}
Widget _buildLegend() {
return Column(
children: <Widget>[
for (final _Slice s in _slices)
Padding(
padding: const EdgeInsets.symmetric(vertical: 7),
child: Row(
children: <Widget>[
Container(
width: 10,
height: 10,
decoration: BoxDecoration(
color: s.color,
borderRadius: BorderRadius.circular(3),
),
),
const SizedBox(width: 12),
Expanded(
child: Text(
s.label,
style: const TextStyle(
fontFamily: _font,
fontSize: 14,
fontWeight: FontWeight.w500,
letterSpacing: 0.24,
color: Colors.white,
),
),
),
Text(
'${(s.amount / _total * 100).round()}%',
style: const TextStyle(
fontFamily: _font,
fontSize: 13,
letterSpacing: 0.24,
color: _muted,
),
),
const SizedBox(width: 14),
SizedBox(
width: 64,
child: Text(
'\$${s.amount.toStringAsFixed(0)}',
textAlign: TextAlign.right,
style: const TextStyle(
fontFamily: _font,
fontSize: 14,
fontWeight: FontWeight.w600,
letterSpacing: 0.24,
color: Colors.white,
),
),
),
],
),
),
],
);
}
Widget _buildTrendCard() {
return Container(
padding: const EdgeInsets.fromLTRB(18, 18, 18, 14),
decoration: BoxDecoration(
color: _surface,
borderRadius: BorderRadius.circular(18),
),
child: Column(
crossAxisAlignment: CrossAxisAlignment.start,
children: <Widget>[
Row(
mainAxisAlignment: MainAxisAlignment.spaceBetween,
children: const <Widget>[
Text(
'Daily spending',
style: TextStyle(
fontFamily: _font,
fontSize: 14.5,
fontWeight: FontWeight.w500,
letterSpacing: 0.24,
color: Colors.white,
),
),
Text(
'This week',
style: TextStyle(
fontFamily: _font,
fontSize: 12.5,
letterSpacing: 0.24,
color: _muted,
),
),
],
),
const SizedBox(height: 18),
SizedBox(
height: 110,
child: Row(
crossAxisAlignment: CrossAxisAlignment.end,
children: <Widget>[
for (int i = 0; i < _trend.length; i++)
Expanded(
child: Column(
children: <Widget>[
Expanded(
child: Align(
alignment: Alignment.bottomCenter,
child: FractionallySizedBox(
heightFactor: _trend[i],
child: Container(
margin:
const EdgeInsets.symmetric(horizontal: 5),
decoration: BoxDecoration(
color: i == 5 ? _brand : _brand.withValues(alpha: 0.35),
borderRadius: BorderRadius.circular(6),
),
),
),
),
),
const SizedBox(height: 8),
Text(
_days[i],
style: const TextStyle(
fontFamily: _font,
fontSize: 11,
letterSpacing: 0.24,
color: _muted,
),
),
],
),
),
],
),
),
],
),
);
}
Widget _buildQuickLinks() {
return Row(
children: <Widget>[
_link(Icons.donut_large_rounded, 'Categories', widget.onCategories),
const SizedBox(width: 12),
_link(Icons.swap_vert_rounded, 'Cashflow', widget.onCashflow),
const SizedBox(width: 12),
_link(Icons.lightbulb_outline_rounded, 'Insights', widget.onInsights),
],
);
}
Widget _link(IconData icon, String label, VoidCallback? onTap) {
return Expanded(
child: InkWell(
borderRadius: BorderRadius.circular(14),
onTap: onTap,
child: Container(
height: 74,
decoration: BoxDecoration(
color: _surface,
borderRadius: BorderRadius.circular(14),
),
child: Column(
mainAxisAlignment: MainAxisAlignment.center,
children: <Widget>[
Icon(icon, size: 22, color: _brand),
const SizedBox(height: 6),
Text(
label,
style: const TextStyle(
fontFamily: _font,
fontSize: 12,
fontWeight: FontWeight.w500,
letterSpacing: 0.24,
color: Colors.white,
),
),
],
),
),
),
);
}
Widget _buildNavBar() {
const List<IconData> icons = <IconData>[
Icons.home_rounded,
Icons.swap_horiz_rounded,
Icons.pie_chart_rounded,
Icons.widgets_rounded,
Icons.person_rounded,
];
const List<String> labels = <String>[
'Home',
'Payments',
'Analytics',
'Hub',
'Profile'
];
return Container(
decoration: const BoxDecoration(
color: _bg,
border: Border(top: BorderSide(color: Color(0xFF2E3235))),
),
child: SafeArea(
top: false,
child: Padding(
padding: const EdgeInsets.symmetric(vertical: 6),
child: Row(
children: <Widget>[
for (int i = 0; i < icons.length; i++)
Expanded(
child: GestureDetector(
onTap: () => widget.onTabSelected?.call(i),
behavior: HitTestBehavior.opaque,
child: Column(
mainAxisSize: MainAxisSize.min,
children: <Widget>[
Icon(
icons[i],
size: 24,
color: i == 2 ? _brand : _muted,
),
const SizedBox(height: 4),
Text(
labels[i],
style: TextStyle(
fontFamily: _font,
fontSize: 10.5,
fontWeight: FontWeight.w500,
letterSpacing: 0.24,
color: i == 2 ? _brand : _muted,
),
),
],
),
),
),
],
),
),
),
);
}
}
class _Slice {
const _Slice(this.label, this.amount, this.color);
final String label;
final double amount;
final Color color;
}
/// Paints a rounded donut chart from the slices, with small gaps between arcs.
class _DonutPainter extends CustomPainter {
_DonutPainter({required this.slices, required this.total});
final List<_Slice> slices;
final double total;
@override
void paint(Canvas canvas, Size size) {
final Offset center = size.center(Offset.zero);
final double radius = size.width / 2 - 14;
const double stroke = 26;
final Rect rect = Rect.fromCircle(center: center, radius: radius);
const double gap = 0.04;
double start = -1.5708; // -90°
for (final _Slice s in slices) {
final double sweep = (s.amount / total) * 6.2832 - gap;
final Paint paint = Paint()
..color = s.color
..style = PaintingStyle.stroke
..strokeWidth = stroke
..strokeCap = StrokeCap.round;
canvas.drawArc(rect, start + gap / 2, sweep, false, paint);
start += (s.amount / total) * 6.2832;
}
}
@override
bool shouldRepaint(covariant _DonutPainter oldDelegate) =>
oldDelegate.total != total || oldDelegate.slices != slices;
}
Plus bundled 1 binary asset (fonts/images). The CLI and MCP install those for you automatically.
Two faster ways to add it
Copy-paste works, but you can skip it entirely.
1. FlutterKit CLI
One command drops this screen — and its fonts — straight into your project.
$ flutterkit add fintech-analytics2. AI agent (MCP)
Connect FlutterKit's MCP server in Claude or Cursor and just ask your agent to install fintech-analytics — it fetches and writes the files for you.
FAQ
Is this spending analytics screen free to use in a commercial app?
Yes. FlutterKit screens are free to use, commercial products included — you can ship this analytics tab in a banking or wallet app you charge for. Copy the code from this page or install it with the CLI command; no attribution required.
Do I need a charting package or google_fonts for this screen?
No packages at all — the vendored code declares an empty dependency list. The donut is a hand-rolled CustomPainter and the weekly bars are plain FractionallySizedBox widgets, so fl_chart and friends never enter the pubspec. The only asset is the Inter font, bundled under `fonts/` and referenced by `fontFamily: 'Inter'`; declare it in your pubspec rather than fetching it through google_fonts.
Which Flutter version does this code need?
Flutter 3.27 or newer, because the dimmed weekday bars use `_brand.withValues(alpha: 0.35)`. On an older SDK, swap that one call for `_brand.withOpacity(0.35)` and everything else compiles; the `super.key` constructor parameter only asks for Dart 2.17+, which any recent Flutter already has.
How do I feed the donut and trend real spending data?
Promote `_slices` and `_trend` from `static const` fields to constructor parameters. Everything downstream already derives from them: `_total` folds the slice amounts, the legend percentages divide by `_total`, and the painter computes sweeps from the same numbers — so nothing else changes. For the weekly bars, normalise your daily amounts to 0–1 (divide each day by the week's maximum) before passing them, since `FractionallySizedBox.heightFactor` expects a fraction, not dollars.
The month pills change highlight but not the numbers — how do I make them filter?
By design the tabs only track `_month`, because the demo data is const. To make them real, hold a `Map<String, List<_Slice>>` (and a matching trend list) keyed by month, look both up from `_month` inside `build`, and the existing `setState` in the pill's `onTap` will re-render the donut, legend and bars for the newly selected month. Alternatively expose an `onMonthChanged` callback and let a parent swap the data in.


